Download PDF
Download page Display.
Display
This section shows all displays used to analyse a SBG Systems INS in real time or from a recorded log.
Device Information
This windows shows the device information in two tabs:
- Device: All information related to inertial device itself (Product Code, Serial Number, Connection Port, firmware and hardware versions)
- GNSS: All information related to the internal GNSS Receiver (Receiver Model and firmware version, as well as unlocked options)

Timing
The Time display shows different sections:
- Clock Synchronization: Status to confirm if PPS is received, and if internal clock is aligned on it.
- UTC Time and Date: Time properly received and used by the INS.
- GPS Time: This time is received from GNSS and maintained with internal clock
- Clock Estimation: Accuracy estimations of the internal clock

Requirement
This display requires the UTC message being output on port A [SBG_ECOM_LOG_UTC_TIME].
Status
The Status windows is divided in 5 tabs:
- General: Main clocks of the INS, CPU usage, and time since the unit is powered up
- Solution: Unit mode, warm-up, and which aiding is used by the algorithm
- Aiding Inputs: Which aiding is received by the INS
- Interfaces: Which serial, CAN, Ethernet interfaces are operational
- Sensors: Show if IMU is operational
Requirement
The General, Aiding Inputs, and Interfaces tab require the Status message being output [SBG_ECOM_LOG_STATUS].
The Solution tab requires at least one EKF message being output. [SBG_ECOM_LOG_EKF_EULER], [SBG_ECOM_LOG_EKF_NAV] etc.. This will also include the [SOLUTION_STATUS].
The Sensor tab requires the IMU message being output [SBG_ECOM_LOG_IMU_DATA].
General Status

Solution Status
This graph shows the status of the algorithm.
- Quality
- Solution Status: can be Vertical Gyro, AHRS, or Full Navigation This is the sbgECom [SOLUTION_MODE]
- Alignment Status: defined when the INS is warmed-up
- Attitude, Heading, Velocity, and Position status green when the standard deviation is under threshold values defined in the Advanced Tab of the configuration
- Used for Solution
- Each line shows when the relevant aiding is currently being used by the EKF algorithm. this is the sbgECom [SOLUTION_STATUS]

Aiding Input
This shows when data are received (properly decoded), but not if the EKF is using them.

Interfaces
Shows open interfaces and if free of communication errors (for instance Port A Transmit would be red if serial port is saturated).

Saturation check
It is advised to check Interfaces Status after modifying the Data output content messages and rate to avoid port saturation.
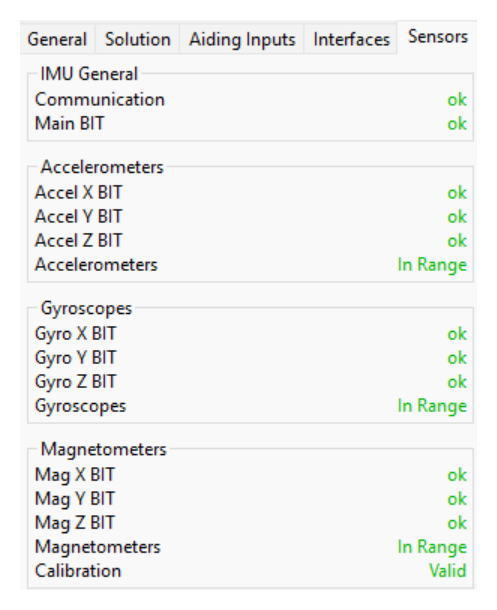
Sensors
Each sensor got a continuously run Build In Test and over-range indicator to indicate the IMU data are valid.
GNSS
This windows is the data directly from the GNSS Receiver on Position, Velocity, Dual Antenna, and Satellites Information

Requirement
The Position section requires the GNSS Position message being output on portA [SBG_ECOM_LOG_GPS1_POS].
The Velocity section requires the GNSS Velocity message being output [SBG_ECOM_LOG_GPS1_VEL].
The True Heading section requires the GNSS True Heading message being output [SBG_ECOM_LOG_GPS1_HDT].
2D Plot
This windows shows the horizontal position of the fused data and GNSS data

Requirement
The EKF trajectory (in blue) require the EKF Nav message being output [SBG_ECOM_LOG_EKF_NAV].
The GNSS 1 trajectory (in red) requires GNSS1 Position message being output [SBG_ECOM_LOG_GPS1_POS].
The GNSS 2 trajectory (in green) requires GNSS2 Position message being output (only for HPI units) [SBG_ECOM_LOG_GP2_POS]
Time Plots
Controls
Scroll in the graph section to zoom in Amplitude

Scroll in the bottom time bar to zoom in Time

Click on the top right black arrow to select which graph to display

Details
The time plot include all displays expressed over a time line.
- Status
- Device Status: CPU status
- IMU Status: Build In Test and sensor saturation indicator
- GNSS 1 Used in Solution: Indication if GNSS aiding is being used by the EKF algorithm
- Solution Status: Quality Indicators EKF data (Attitude, Heading, Velocity, and Position)
- Used in Solution: aiding used in solution
[SBG_ECOM_LOG_STATUS],[SOLUTION_STATUS]
- IMU Sensors
- Accelerations: Data from accelerometers
- Angular Rate: Data from Gyroscopes
- Temperature: internal temperature probe of the INS
[SBG_ECOM_LOG_IMU_SHORT]
- IMU Compensated
- Same as IMU data but with gravity and sensor biases removed, and expressed in body or NED reference frame
[SBG_ECOM_LOG_EKF_ROT_ACCEL_BODY],[SBG_ECOM_LOG_EKF_ROT_ACCEL_NED]
- Same as IMU data but with gravity and sensor biases removed, and expressed in body or NED reference frame
- Attitude
- Euler Angles; Roll/Pitch/Yaw expressed in radian or degrees
[SBG_ECOM_LOG_EKF_EULER], ,[SBG_ECOM_LOG_EKF_QUAT]
- Euler Angles; Roll/Pitch/Yaw expressed in radian or degrees
- Accuracy
- Standard deviation from attitude, velocity, and position
- Navigation
- Altitude and Velocity (Note: the horizontal position is expressed in the 2D Plot)
[SBG_ECOM_LOG_EKF_NAV],[SBG_ECOM_LOG_EKF_VEL_BODY]
- Altitude and Velocity (Note: the horizontal position is expressed in the 2D Plot)
- Ship Motion
- Heave, Surge, and Sway
[SBG_ECOM_LOG_SHIP_MOTION]
- Heave, Surge, and Sway
- Aiding
- Data directly read from specific aiding sensor (Magnetometer, Pressure, Barometer altitude, Airspeed sensor, Odometer)
[SBG_ECOM_LOG_GPS1_VEL],[SBG_ECOM_LOG_GPS1_POS],[SBG_ECOM_LOG_GPS1_HDT],[SBG_ECOM_LOG_ODO_VEL]
- Data directly read from specific aiding sensor (Magnetometer, Pressure, Barometer altitude, Airspeed sensor, Odometer)
- GNSS 1
- Data directly from GNSS receiver (without going through the EKF algorithm)
[SBG_ECOM_LOG_GPS1_VEL].[SBG_ECOM_LOG_GPS1_POS].[SBG_ECOM_LOG_GPS1_HDT]
- Data directly from GNSS receiver (without going through the EKF algorithm)
- DVL
- Data directly from the Doppler Velocity Log sensor
[SBG_ECOM_LOG_DVL_BOTTOM_TRACK][SBG_ECOM_LOG_DVL_WATER_TRACK]
- Data directly from the Doppler Velocity Log sensor
- Clock
- Estimated bias and scale factor of the internal clock
[SBG_ECOM_LOG_UTC_TIME]
- Estimated bias and scale factor of the internal clock
- Events
- Incoming pulses arriving on Input Synchronization pins
[SBG_ECOM_LOG_EVENT_A] etc..
- Incoming pulses arriving on Input Synchronization pins

Cockpit View
This aircraft attitude indicator display allows for a quick and intuitive Roll/Pitch/Heading visualization, no matter the motion profile used.

Requirement
This display requires to have EKF Euler or EKF Quaternion message being output [SBG_ECOM_LOG_EKF_EULER], [SBG_ECOM_LOG_EKF_QAT].
3D View
This is an alternative to the cockpit display to display Roll/Pitch/Heading, but without measurement indicators.

Requirement
This display requires to have EKF Euler or EKF Quaternion message being output [SBG_ECOM_LOG_EKF_EULER], [SBG_ECOM_LOG_EKF_QAT].