This article shows how to use Qinertia Cloud to estimate the lever arms from the IMU to the GNSS antennas in order to able to refine the lever arms entered in the Ellipse.
Qinertia Cloud is free during the beta period. You won’t be charged, and no payment method is required. We’ll notify you before the beta ends.
Required Data
The acquisition should have RTK or PPP accuracy in good GNSS environment and with enough motion dynamics such as 8 shapes maneuvers. The log must to have a minimum duration of 20 minutes.
For better accuracy, the acquisition has to be recorded with RTK corrections.
The required log must contain at least these messages for the lever arm estimation:
| Messages | Output rate |
|---|
| UTC | 1 Hz |
Info, Settings (Ellipse products) Session info (Other products) | New Data |
| System Status | 1 Hz |
| IMU Short | 200 Hz |
| GNSS1 Velocity | New Data |
| GNSS1 Position | New Data |
| GNSS1 True Heading (When available) | New Data |
GNSS1 Raw Data | New Data |
| Odometer (When available) | New Data |
| DVL Bottom Track (When Available) | New Data |
| DVL Water Layer (When Available) | New Data |
| Air Data (when Available) | New Data |
GNSS lever arm estimation using Qinertia Cloud
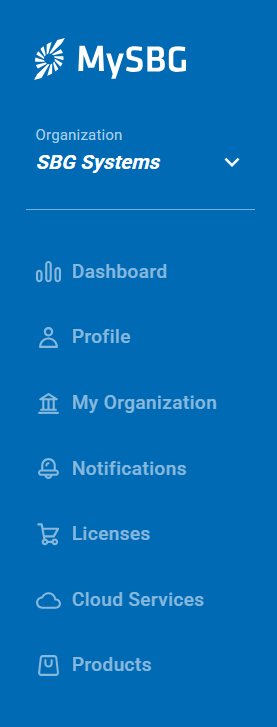
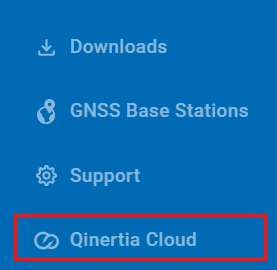
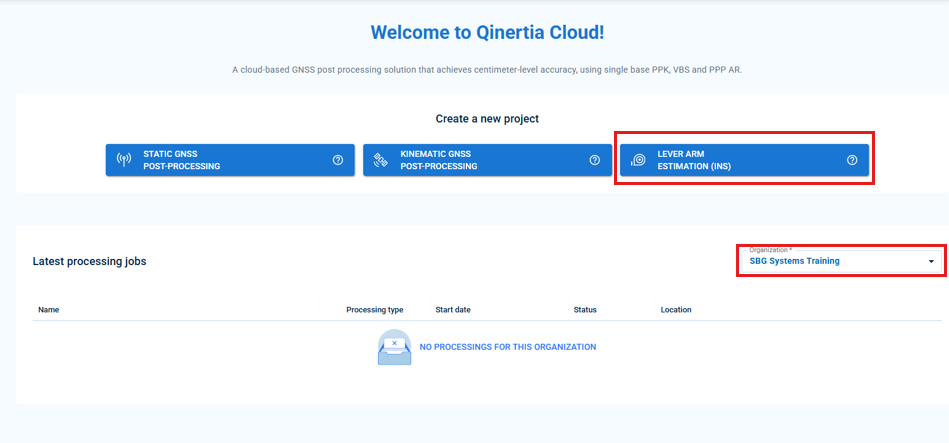
Step 1: Create or connect to your MySBG account and then select the Qinertia cloud tab in the left panel
Step 2: Select your organization, and click on Lever Arm Estimation
Step 3: Project creation
The following view will appear. The project name and the email address have to be completed.
The email address will be used to receive the results report.
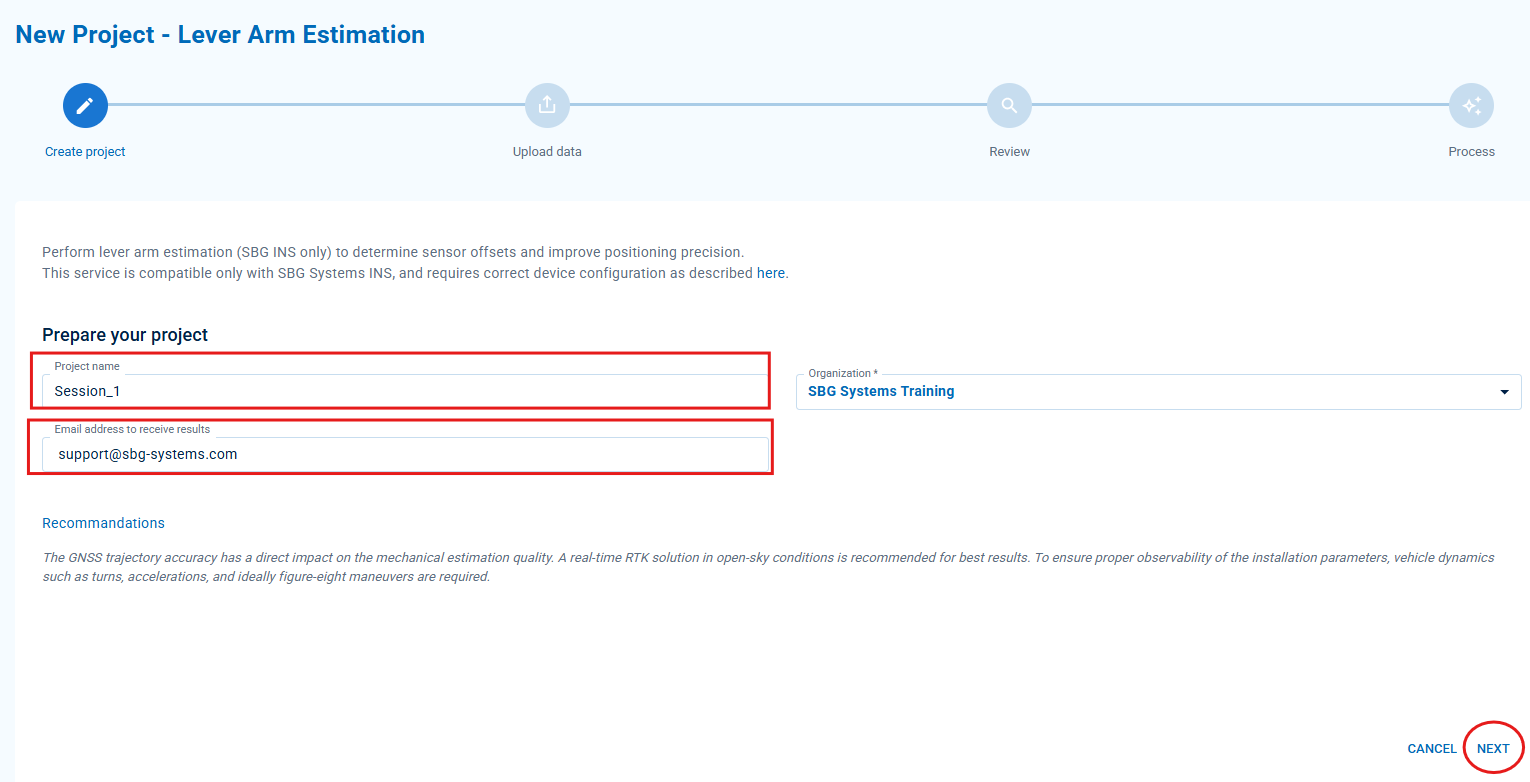
After completing the fields, click on NEXT.
Step 4: Uploading data
The log can be dragged and dropped in the dedicated space.
Data format
The message SBG_ECOM_LOG_SESSION_INFO will be used to import the settings if it is activated. This message is available on the High Performance INS products and Ellipse with the firmware 3.
If a JSON configuration file is also provided, the parameters will be extracted from it rather than from the SBG_ECOM_LOG_SESSION_INFO message.
After uploading the data, the view will be as the following one:
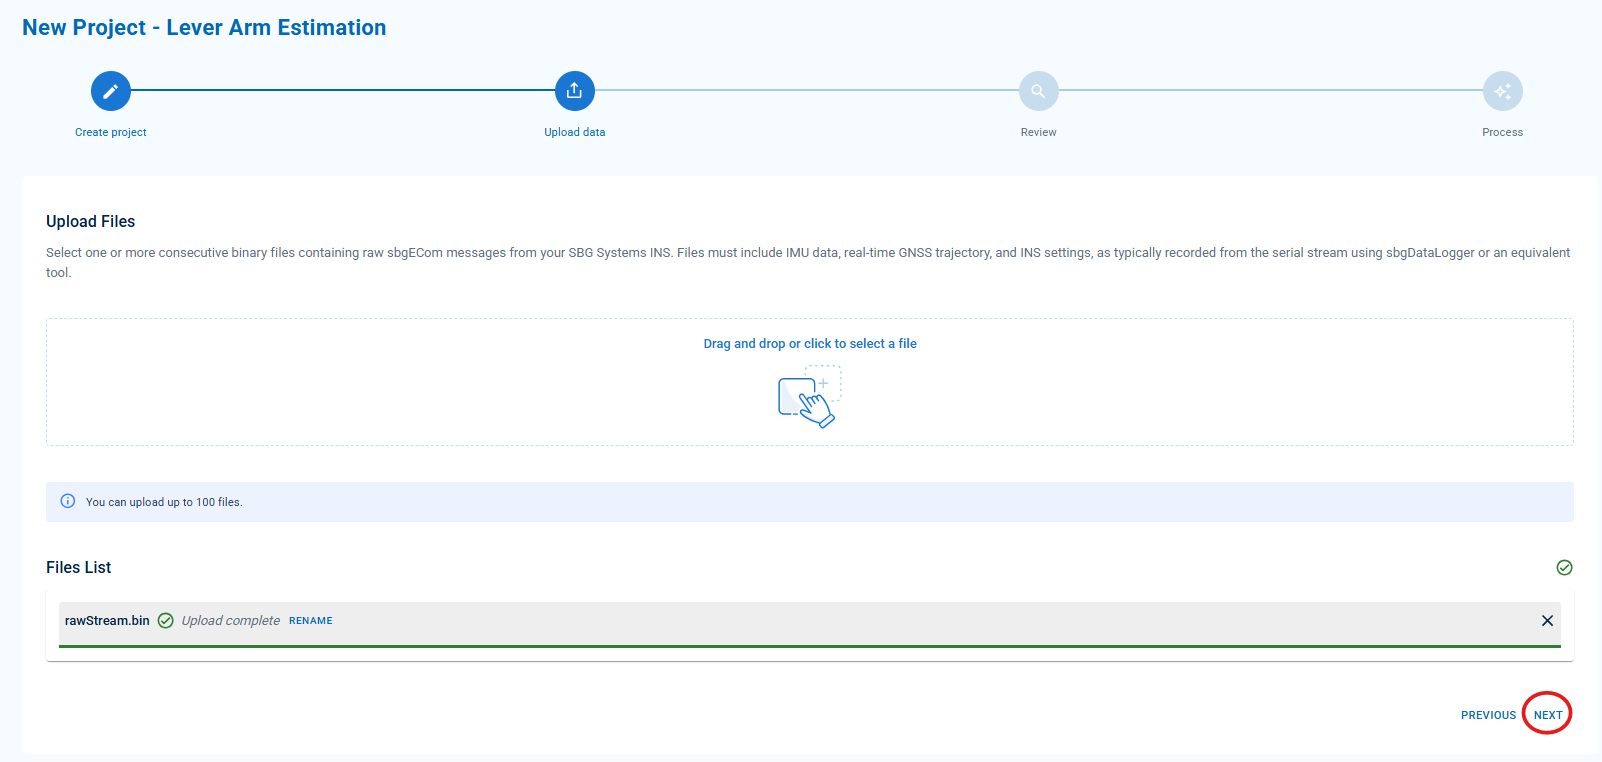
Then, click on NEXT.
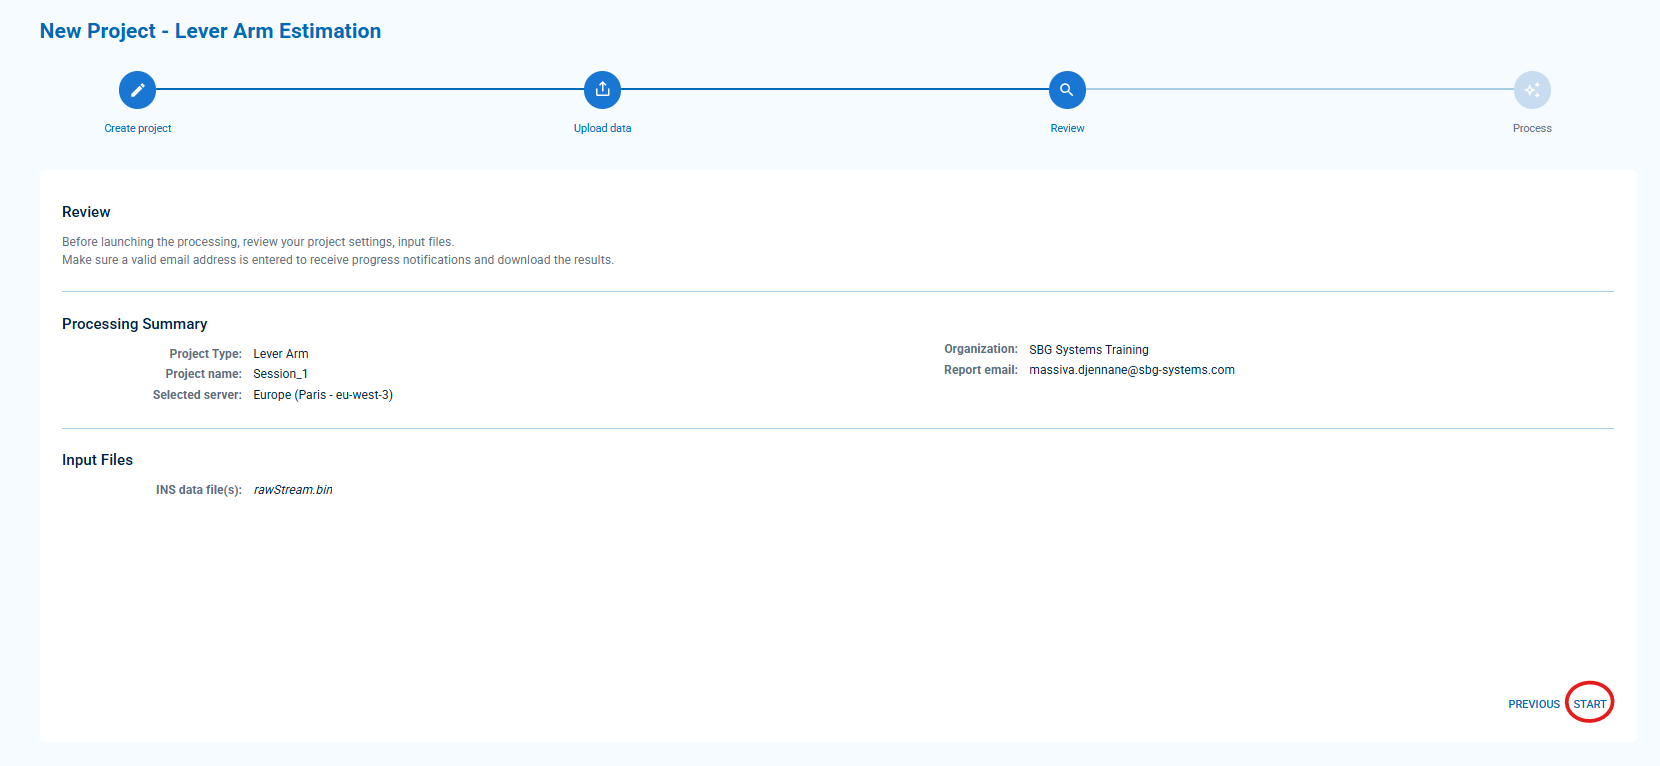
Step 5: Reviewing the informations
This step gives the general view of all the informations mentioned before.
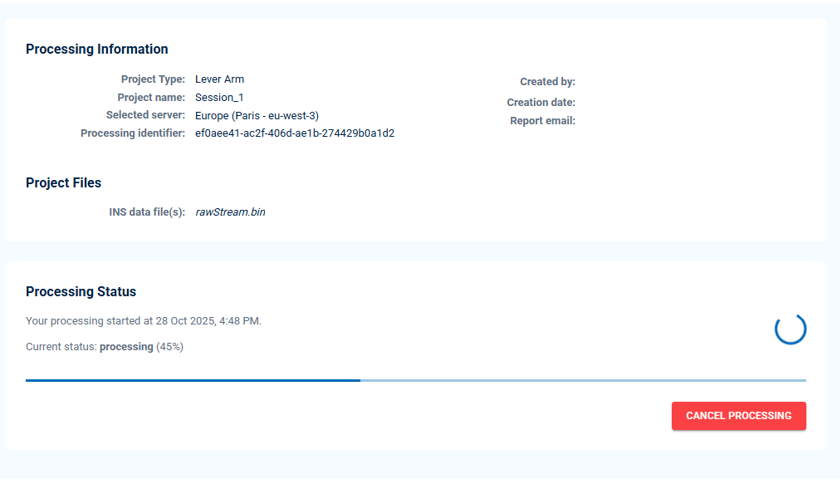
Step 6: The processing
During this step, the data are being processed. Some indicators about the time to wait in the queue will appear.
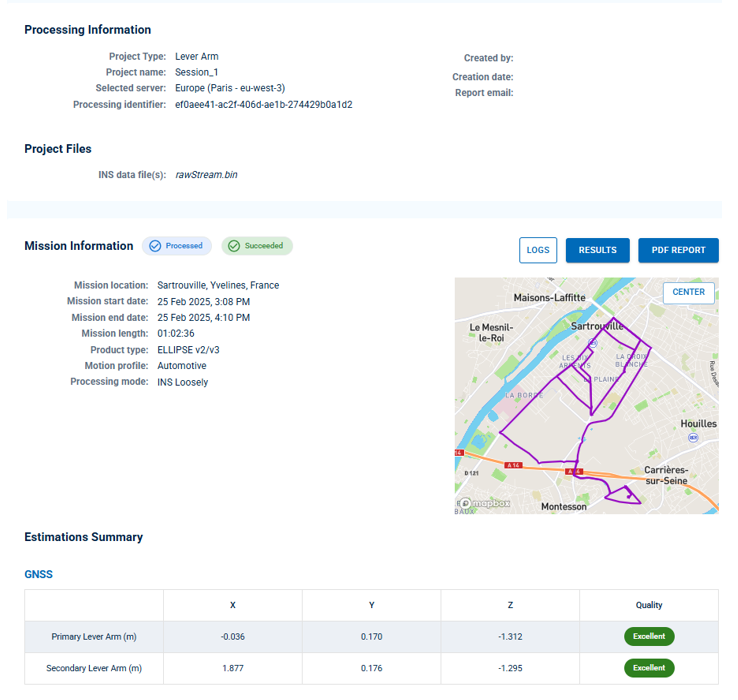
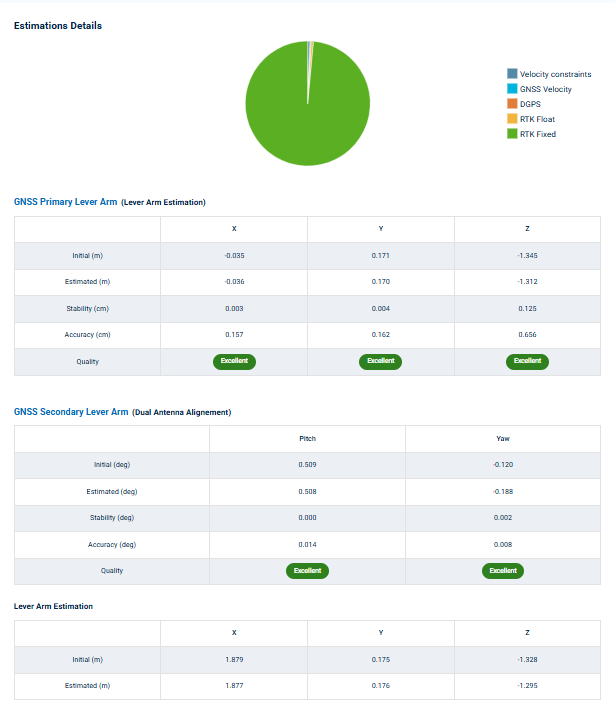
Step 7: The results
The results will be displayed in the interface. If you click on Results, you'll be able to download both PDF and JSON reports.