Doc for Ellipse firmware ≥ 3.0
You are currently viewing the documentation for an Ellipse running firmware version ≥ 3.0. If your Ellipse is operating on firmware version 2.x or earlier, please use the version picker in the top-right corner of the page to select the appropriate version.
Data logging for Ellipse range can easily be made with our data logging tools, available in the SDK package.
This brief document guides you in the process of making data logs that can be used by SBG Systems to support you efficiently.
Step 1 : Configuration
The configuration step will be done using the sbgCenter, available also in the SDK package. The Getting Started section will help you connect to the Ellipse.
Set output logs
In the Input/Output section, the serial port that will be used for data logging must be enabled and configured to the appropriate baudrate.
The baudrate should be high enough to avoid port saturation. We recommend at least 460800 bauds.
Then, in the Data Output section, the appropriate output logs for support should be configured as defined below :
Log | Output Rate |
|---|
UTC | 1 Hz |
System Status | 1 Hz |
| Info, Settings | On New Data |
IMU Short | 200 Hz |
EKF Euler | 50 Hz |
EKF Nav | 50 Hz |
| Magnetometers* | 50 Hz |
| Mag Calib Data* | On New Data |
Ship Motion* | 50 Hz |
GPS1 Velocity | On New Data |
GPS1 Position | On New Data |
GPS1 True Heading* | On New Data |
GPS1 Raw Data | On New Data |
| GPS1 Satellite | On New Data |
Odometer Velocity* | On New Data |
DVL Bottom* | On New Data |
DVL Water* | On New Data |
| AirData* | On New Data |
* Logs must only be selected if applicable.
Maximum Output Data Rate
The Output Data Rate (ODR) specified in this page is the recommended ODR for our support.
However, the Ellipse supports higher ODR for some messages, for example the maximum ODR for IMU Short, EKF Euler and EKF Nav are 1kHz.
Step 2 : Logging the data
You can log output messages using our user-friendly data logging tools tool, which are conveniently included in the SDK package.
For a detailed step-by-step guide on how to log data using our tools, kindly refer to our guides on using sbgCenter (recommended for support) or sbgDataLogger.
Step 3: Retrieve and analyse data
The data logged using our data logging tools can be accessed from the logging directory and analyzed using sbgCenter.
To do so :
- Stop the logging.
- Open the sbgCenter tool.
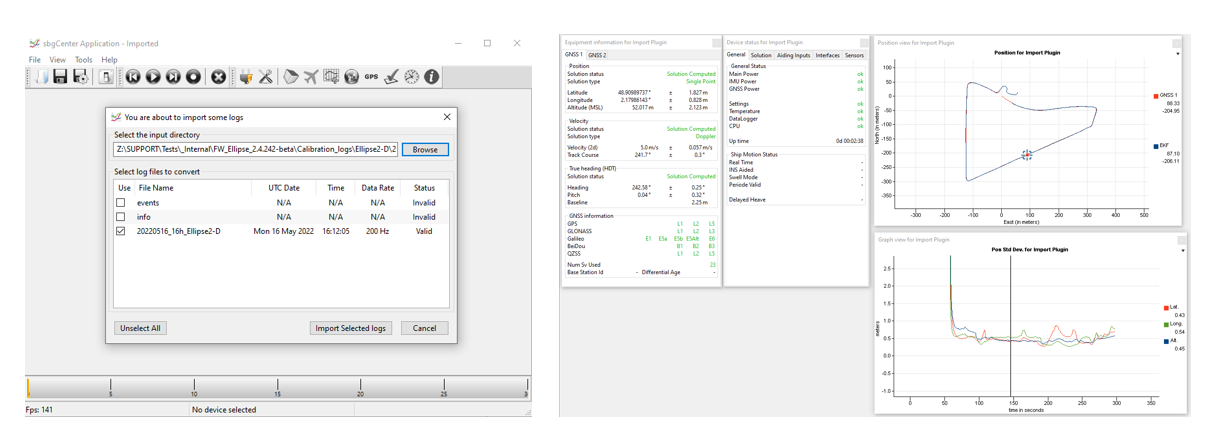
- Go to File > Import Log.
- Select the desired file to import.
- Click on "Import Selected Logs".
You can analyze data : display the 2D position, check the data quality by displaying the appropriate graphs, etc.
The settings file can't be retrieved from the data logged by sbgDataLogger. It is recommended to save it from the sbgCenter after the unit's configuration.