Download PDF
Download page Data-Logging For Support Purpose.
Data-Logging For Support Purpose
Thanks to the internal data-logger, data-logging is easy with SBG High Performance products: an 8GB internal memory allows up to 48h of data to be stored internally.
This brief document guides you in the process of making data logs that can be used by SBG Systems to support you efficiently.
Step 1: Configuration
Check Data-logger free space
Make sure that there is free space available on the internal data logger.
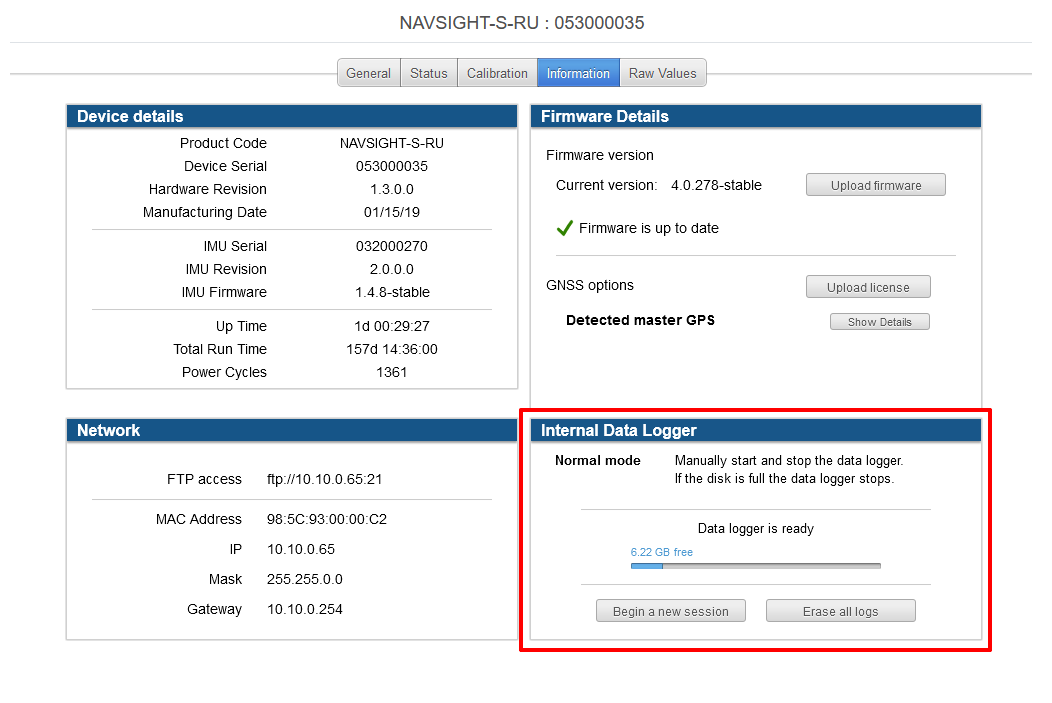
In case you need to free some space, please click on “Erase Logs” button.
Set output logs
Configuration will be done on the web interface, by clicking on configure button then in Data Output → Data Logger section.
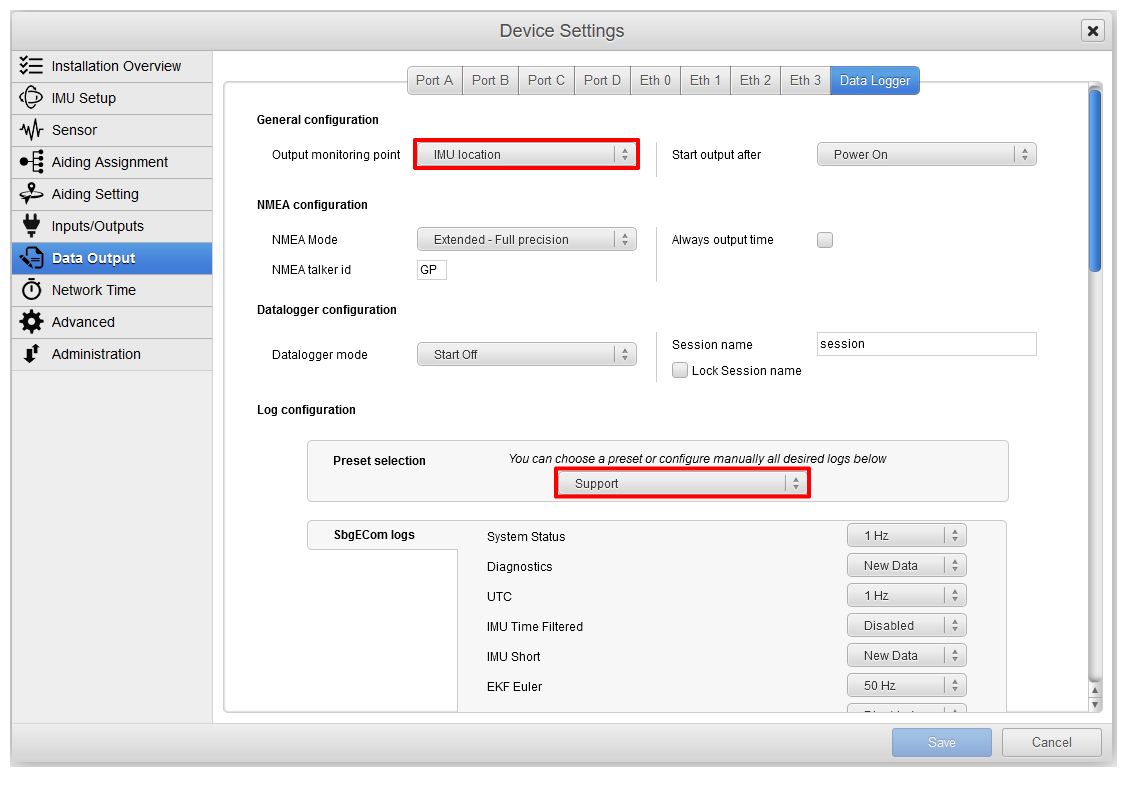
Output Monitoring Point
You can choose where you want the logged data to be output at in case you wanted to log the data at a specific reference location.
When creating logs for the support team, please use the IMU Location setting.
Preset Selection
There are multiple presets available that will automatically configure the data logger to log a list of messages.
A Support preset selection is available to automatically enable Support requested outputs.
Start Output after
This setting will allow you to choose when to start recording data to avoid filling the data logger with useless data:
- Power On should be set in order to start recording data as soon as the system is powered up.
- UTC Valid should be set in order to start recording data as soon as the GNSS receiver sends a valid UTC time to the system.
- Position Valid should be set in order to start recording data as soon as the system is initialized with a valid position.
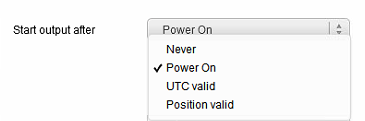
When creating logs for the support team, please use the Power On setting.
Datalogger Mode
This setting will allow you to choose the initial state of the data logger when powering up the system:
- Start Off will leave the data logger disabled when powering up the system.
- Start On will enable the data logger as soon as the system is powered up. But the datalogger won't start logging data until the condition chosen in the section "Start Output After" is met.
- Resume State will keep whatever state the data logger was in before being powered down the last time it was used.
- Blackbox will ensure the data logger is always logging data. If the data logger is full, then the oldest data will be overwritten by the new data continuously.
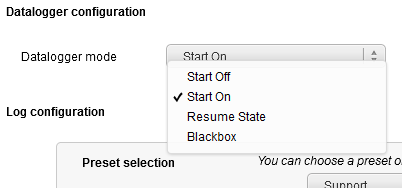
When creating logs for the support team, please use the Start On setting.
Session Name
It is possible to give a name to a session. A new file is created each hour so a session can contain multiple files. This session name will then be on all the files logged in the same session, as well as the time of start of the file.
Preset Selection
There are multiple presets available that will automatically configure the data logger to log a list of messages.
Step 2: Start the logging Run
Now that the sensor is configured for data logging, you can start your operations. The data-logger interface does not need any special action or connection once configured.
Please make sure you log continuously as only contiguous log files can be opened together. If you need help from support we recommend logging at least 15 minutes of data, the data should start from power on of the system and include the event that needs to be checked.
Step 3: Retrieving and analyzing the data
First stop the logging in the Internal Data logger section of the Information tab.
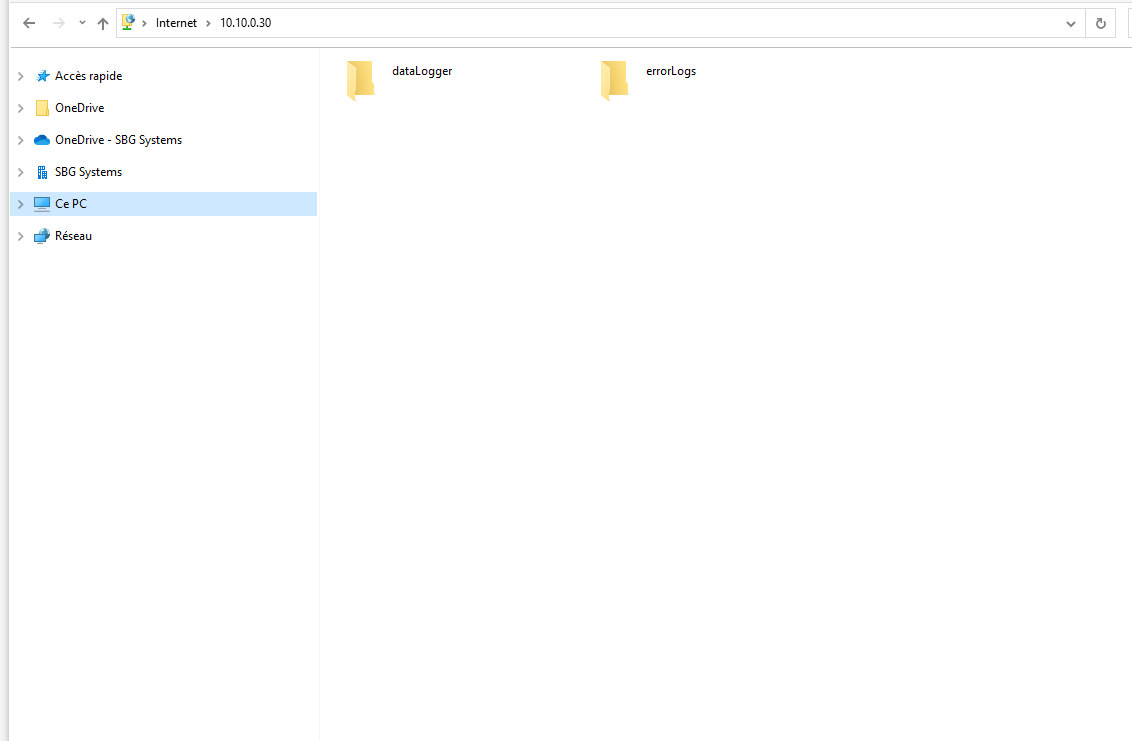
In order to access the recorded data, connect the sensor on the network, and use Windows explorer to access the logs.
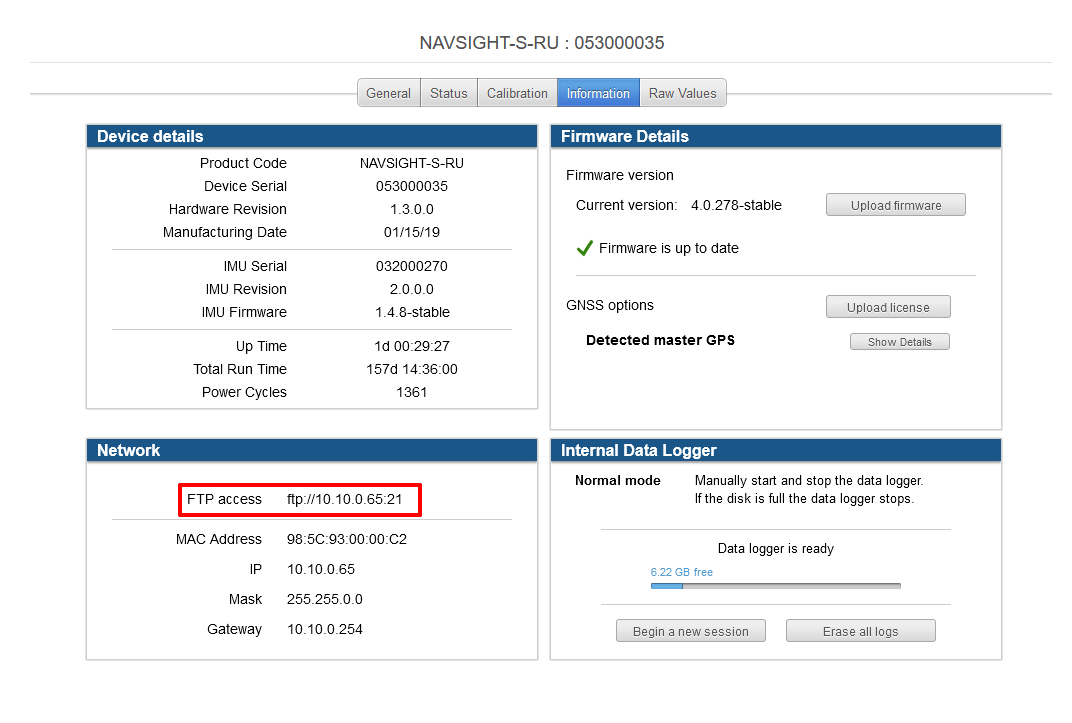
Enter the FTP address displayed in the Information tab in your Windows Explorer address or your favorite FTP client.
The errorLogs folder contains all the error logs, it is recommended to also save these for support if needed.
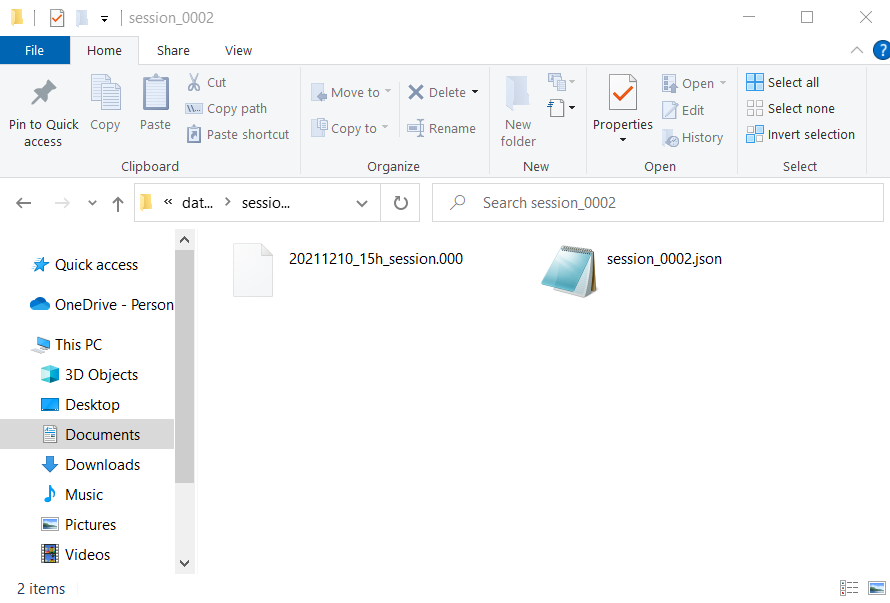
When opening a session folder, you will find all the data logged as well as a JSON file containing the configuration of the system.
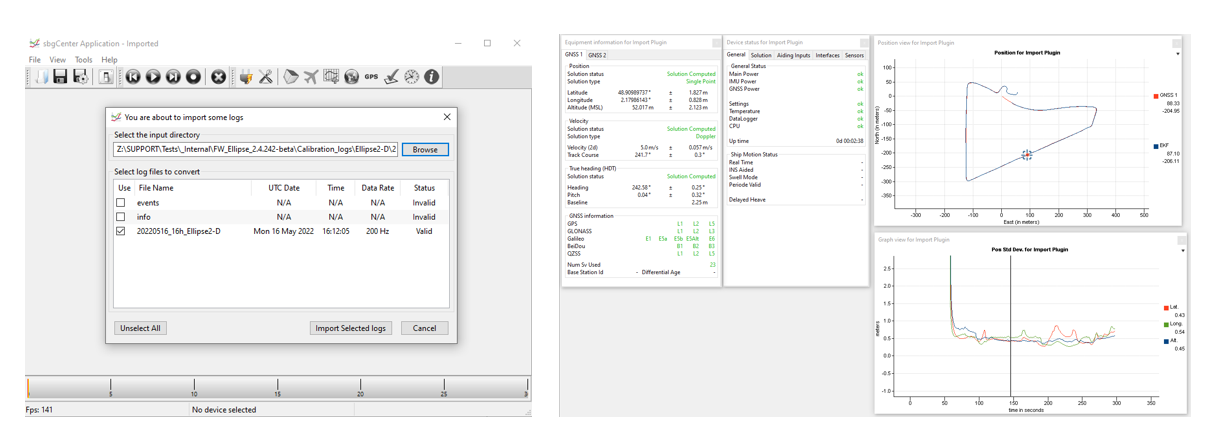
The data logged using sbgDataLogger can be accessed from the logging directory and analyzed using sbgCenter.
To do so :
- Stop the logging.
- Open the sbgCenter tool.
- Go to File > Import Log.
- Select the desired file to import.
- Click on "Import Selected Logs".
You can analyze data : display the 2D position, check the data quality by displaying the appropriate graphs, etc.