Download PDF
Download page First connection to Navsight Products.
First connection to Navsight Products
This tutorial will show you the initial connection with Navsight from SBG systems, where to find the software and manuals.
Downloading the sbgCenter Application
The Navsight embeds a web interface allowing to connect to the sensor to configure and monitor it but we advise you to install the latest sbgCenter Application which helps in integrating and monitoring the sensor.
Documentation and Resources
This center provides access to all the documentation you might need during your product evaluation and integration:
You can find the documentation and resources for Navsight such as hardware manual, mechanical drawings in the Navsight Documentation section.
On this link you will find the Operating Handbooks and external aiding integration guides.
You can also find the Firmware manual and sbgECom, as well as all Firmware releases and change notes.
Hardware Connection
The Navsight solution is a cutting edge navigation system dedicated to Marine, Land and Air Survey Applications. It has been designed for optimal integration with Qinertia post-processing suite, as well as popular survey software like Qinsy, Hypack, PDS and others.
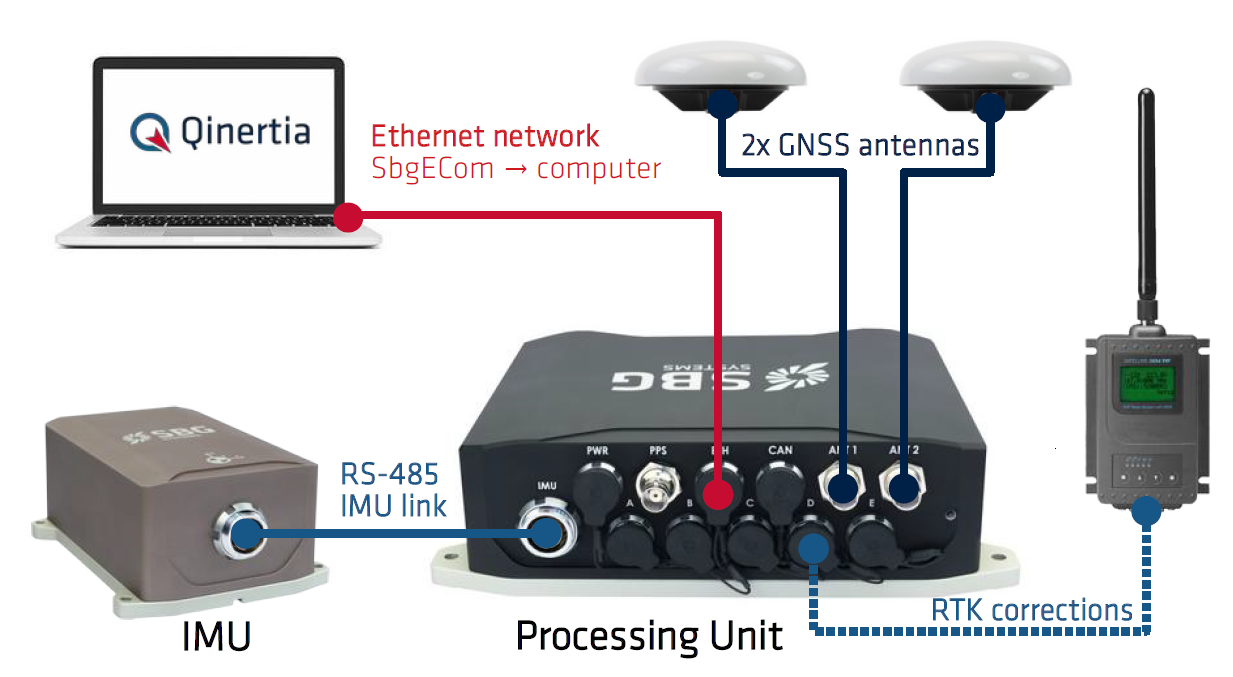
You will receive an IMU, a processing unit, 2x GNSS antennas together with the cables needed for powering the system, connecting the different accessories, and communicate with the unit.
Various cables provides:
- Connection to the IMU
- Ethernet connection
- Serial RS232 / 422 ports
- 1 x Can bus
- Synchronization / Event markers
Ethernet cable has to be connected to access the web interface.
The Illustration below shows an example of connection of the different pieces.
Processing Unit Keypad
The Navsight processing unit integrates a membrane keypad that gives a quick view about sensor health and status, and allows a few common actions like power up or down, enable or disable data-logging.
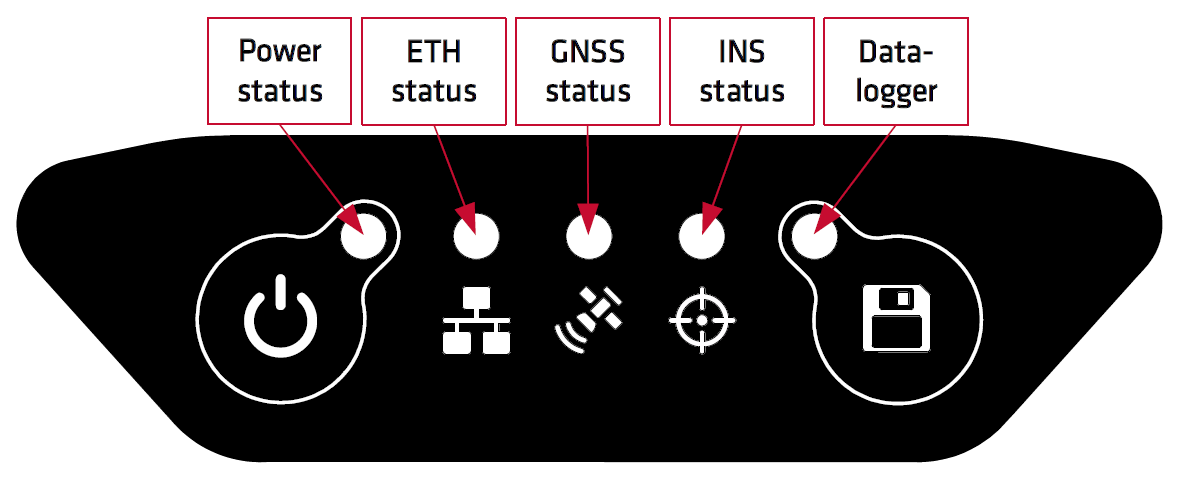
Full description of the LEDs status indicators is available in the Navsight - Hardware Manual.
Connection to the Web Interface
The Navsight embeds a web interface which can be either accessed using the sbgCenter or directly from any modern web browser.
To directly access the device web interface, simply type the product name and serial number in your web browser URL field as shown below:
● http://navsight_xxxxxxxxx.local/
With xxxxxxxxx being the serial number of the system.
For best experience, SBG Systems recommends the following web browsers to be used:
● Chrome / Safari
● Firefox
● Edge
Web Interface
Once connected, you can open the different tabs available on the web interface, as shown in the screenshots below.
Monitoring and informationGeneral and Status tabs allow monitoring the sensor. Information allows retrieving information, controlling the logger and managing firmware version.


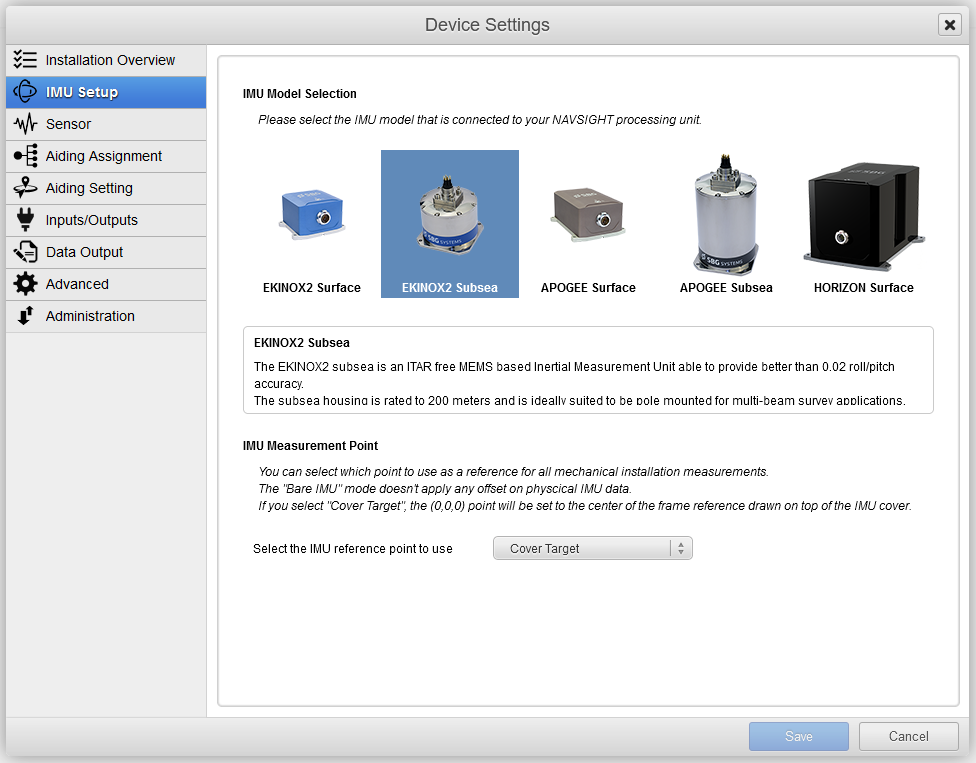
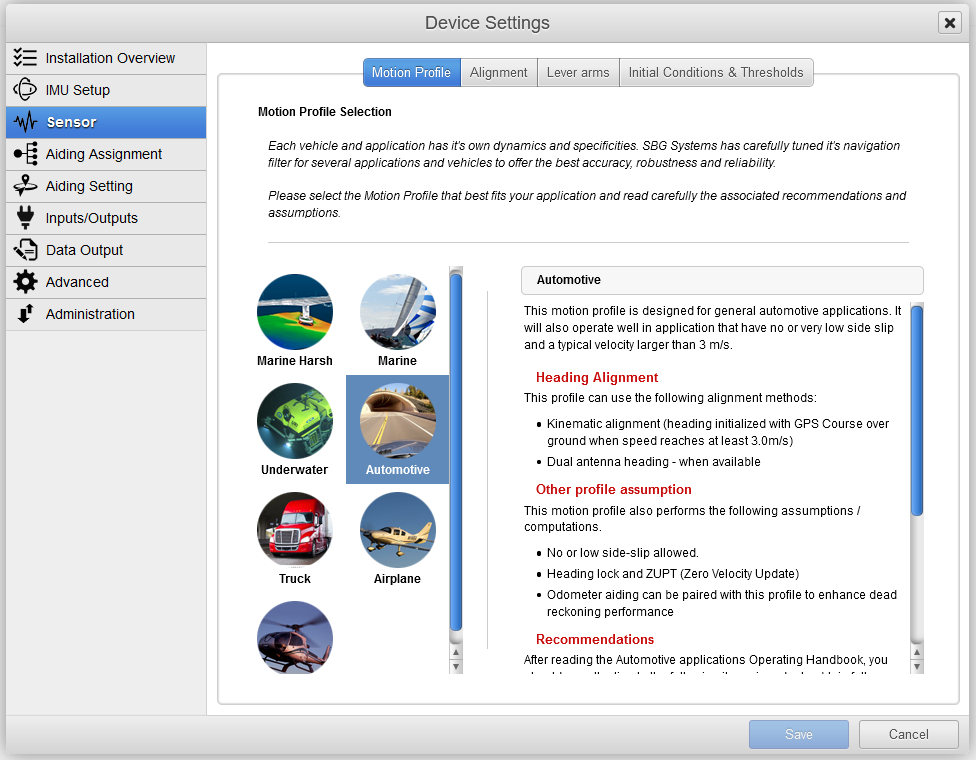
Configuring your product
The configure button will give you access to the configuration menu so you can select the IMU used and set the system for your application.

You can find find guidance to configure your product for specific applications in the Operating Handbooks section.
Interface to third party software and systems.
The INS is compatible with most popular survey software suites such as Qinsy, Hypack, or PDS2000 using their dedicated driver.
In addition to specific driver developed, the Navsight series is compatible with a wide range of third party devices thanks to the support of NMEA protocol as well as other protocols (ie; TSS1, Kongsberg, …). This enables seamless integration into existing systems using those protocols.
Communicate with the sbgECom library
A convenient way to interface a Navsight with C programs is to use the sbgECom library. With simple C functions, you can retrieve the device's output very quickly. Library source code is provided with example to help you to start. Have a look here: Binary protocol Library (sbgECom)
Data logging using internal logger
The sensor embeds a data logger with 8 GB of memory. We advise, as good practice to set up the internal data logger to start at power on, and set it on Support preset, as you can retrieves all necessary logs for analysis, post processing or even trouble shooting.
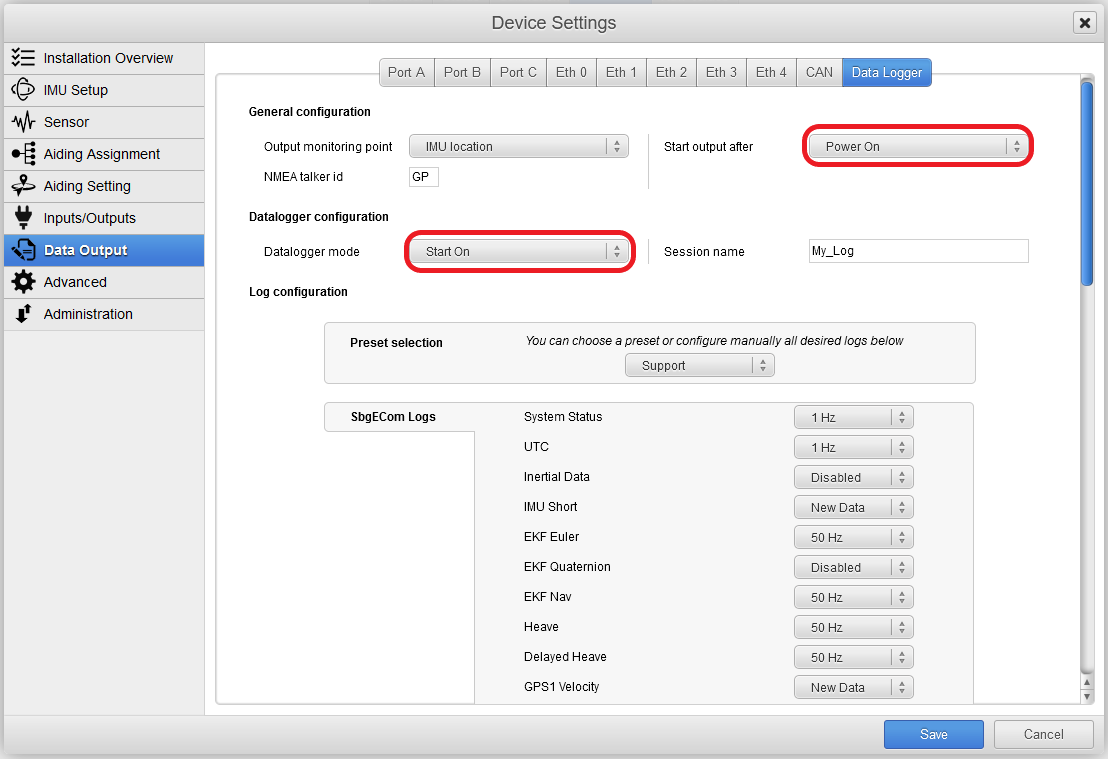
We advise, as good practice to set up the internal data logger to start at power on, and set it on Support preset, as you can retrieves all necessary logs for analysis, post processing or even trouble shooting.
Record data for post processing
A typical use of Navsight solution is to store the IMU and GNSS data on the datalogger for post-processing after the mission. This can be done easily by pressing the saved button on Navsight key pad:
![]()
Or through the main web page, by clicking on the datalogger button.
Once the mission is finished, you can get the logged data back using the FTP server, at this address:
ftp://navsight_xxxxxxxxx.local./ with xxxxxxxxx being the serial number of the system.
The recorded files can be directly used by Qinertia post processing suite. You can find details in High Performance INS - Post-Processing Guide.